
Page 65 - newDATAmagazine® | 15>07>2022
P. 65
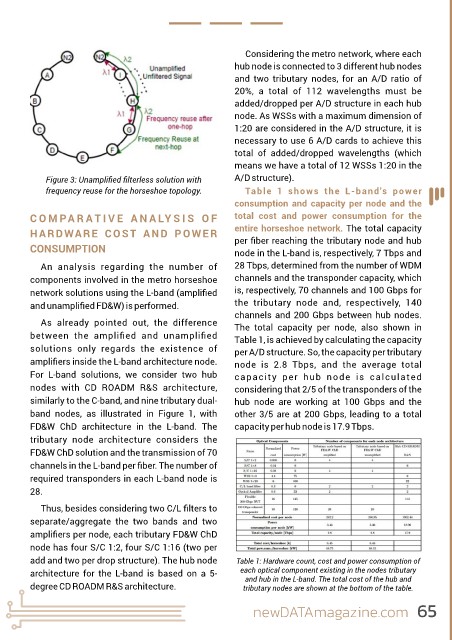
Considering the metro network, where each
                                                               hub node is connected to 3 different hub nodes
                                                               and  two  tributary  nodes,  for  an  A/D  ratio  of
                                                               20%,  a  total  of  112  wavelengths  must  be
                                                               added/dropped per A/D structure in each hub
                                                               node. As WSSs with a maximum dimension of
                                                               1:20 are considered in the A/D structure, it is
                                                               necessary to use 6 A/D cards to achieve this
                                                               total  of  added/dropped  wavelengths  (which
                                                               means we have a total of 12 WSSs 1:20 in the

             Figure 3: Unamplified filterless solution with      A/D structure).
             frequency reuse for the horseshoe topology.          Table  1  shows  the  L-band's  power
                                                               consumption and  capacity  per  node  and  the

         C O M PA R A T I V E   A N A LY S I S   O F           total  cost  and  power  consumption  for  the
         HARDWARE  COST  AND  POWER                            entire horseshoe network. The total capacity
                                                               per fiber reaching the tributary node and hub
         CONSUMPTION                                           node in the L-band is, respectively, 7 Tbps and

            An  analysis  regarding  the  number  of           28 Tbps, determined from the number of WDM
         components involved in the metro horseshoe            channels and the transponder capacity, which
         network solutions using the L-band (amplified          is, respectively, 70 channels and 100 Gbps for
         and unamplified FD&W) is performed.                    the  tributary  node  and,  respectively,  140
                                                               channels and 200 Gbps between hub nodes.
            As  already  pointed  out,  the  difference        The  total  capacity  per  node,  also  shown  in
         between  the  amplified  and  unamplified               Table 1, is achieved by calculating the capacity
         solutions  only  regards  the  existence  of          per A/D structure. So, the capacity per tributary
         amplifiers inside the L-band architecture node.        node  is  2.8  Tbps,  and  the  average  total
         For  L-band  solutions,  we  consider  two  hub       capacity  per  hub  node  is  calculated

         nodes  with  CD  ROADM  R&S  architecture,            considering that 2/5 of the transponders of the
         similarly to the C-band, and nine tributary dual-     hub  node  are  working  at  100  Gbps  and  the
         band  nodes,  as  illustrated  in  Figure  1,  with   other 3/5 are at 200 Gbps, leading to a total
         FD&W  ChD  architecture  in  the  L-band.  The        capacity per hub node is 17.9 Tbps.
         tributary  node  architecture  considers  the
         FD&W ChD solution and the transmission of 70


         channels in the L-band per fiber. The number of
         required transponders in each L-band node is
         28.
            Thus, besides considering two C/L filters to

         separate/aggregate  the  two  bands  and  two
         amplifiers per node, each tributary FD&W ChD
         node has four S/C 1:2, four S/C 1:16 (two per
         add and two per drop structure). The hub node         Table 1: Hardware count, cost and power consumption of
         architecture  for  the  L-band  is  based  on  a  5-   each optical component existing in the nodes tributary
                                                                  and hub in the L-band. The total cost of the hub and
         degree CD ROADM R&S architecture.                       tributary nodes are shown at the bottom of the table.


                                                                    newDATAmagazine.com 65